

A free FBA calculator helps sellers get just a rough pre-sale profit estimation, which may not be enough in cases when your profit margin is not very high. Read our blog to find out how you can calculate all fees Amazon charges you and estimate your actual profit.
A free FBA calculator is usually applied by sellers to easily get the pre-sale estimate. It helps to understand how much Amazon will charge and what profit you will get. At the same time, you may not be aware of how much Amazon charges for FBA monthly storage or referral fee, or which fees burn your profit.
Very often, when selling on Amazon, merchants calculate Amazon fees with the Amazon FBA fee calculator. Amazon fee calculator seems to be an easy and practical tool to estimate your profit when making sales on Amazon. But, unfortunately, no less often you run into the situation when the revenue is at the far end much lower than you expected. And if you are seriously intending to make money selling on Amazon, you need to understand how to calculate Amazon fees, what burns your Amazon profit, and how to avoid it.
The first thing you need to understand is that Amazon charges you for every service. Some fees are quite substantial, some are small, but in total it’s 80+ different fees and commissions. Some of those, like Product charges, Product rebates, Amazon Fee you can see in your Seller Central.
Why Do You Need More than an Amazon Fees Calculator?
To calculate Amazon fees, which are quite numerous, sellers would consider tools like Amazon profit calculator, FBA revenue calculator, or Amazon fulfillment fees calculator. Free FBA profit calculator could help you do the rough pre-sale estimates, but it’s not going to show you the real profit because it doesn’t take into consideration all expenses, like, for instance, FBA monthly storage or referral fee. SelleRise Profit&Loss can do it for you.
When you miss out on two small fees for one of your products, this is most likely not a problem, though the profit calculation will not be accurate. But when you sell hundreds of items, the missed fees might pile up like a snowball rolling down the hill, burning down your profit.
How Can Third Party Software Help You Accurately Account for FBA Figures?
Once you start selling on Amazon FBA, it's a good idea to use third-party seller software to help you work with numbers and save your time, since in the Seller Central account you don’t have all tools to deal with your business analytics metrics. Here are four reasons why.
1. Free FBA Calculator takes a long time to enter numbers and is tedious
To find out the Amazon commission for a product, you need to manually enter the product name, ASIN, or UPC. After the calculation, you will see histograms that show the difference in FBA and FBM fees (Fulfillment By Merchant - the seller is responsible for the delivery and processing of goods).
This tool does not allow you to save the Amazon Margin Impact calculation, so you need to manually enter all the data (retail price and other numbers) all the time. With SelleRise Dashboards it’s easy.
2. There is no way to export data in Excel or copy it into your files
Using the free FBA calculator from Amazon, you will not export the results as a .csv file or any other type of file. This is uncomfortable because you must record each fee separately when you track costs (for example, to compare which products will have a higher profit margin). Converting promotions into your profit also takes a lot of time.
Some of you need to switch from one tab to another. Use the Alt and Tab keyboard shortcut (by holding Alt and pressing Tab on Windows); it will make your work quick and easy while you recording the costs created in the free FBA calculator in your Excel (or Google Sheets) documents.
You can forget about all these problems if you'll use SelleRise software, which independently calculates the profitability of your products and stores all data.
3. Product margins can't be compared using the free FBA calculator
You can only calculate the FBA commission in the free Amazon tool one at a time. In the same way, there is no possibility to export data to spreadsheets for comparison and further processing.
SelleRise connects to your Seller Central account using the Amazon API. It analyzes the information in your Seller Central account, but it doesn't overwrite or change the data. It processes and presents the data in clear and simple dashboards to show your Amazon business performance.
SelleRise dashboards show:
- Sales and Profit for a custom date range;
- You can compare sales from advertising and organic sales;
- You get profitability for each SKU;
- You see the money that Amazon may owe you for Lost&Damaged items, or Customers Returns.
By researching a product before you start selling on Amazon FBA, you need to know that profit margin isn't the only indicator of a highly profitable business. The sales rating, the number of competitors, the number of reviews, the FBA fees, the storage mistakes, and many other indicators affect your profit from selling on Amazon FBA. But you won't know all these numbers using a free tool from Amazon.
4. Free FBA calculator doesn't include additional costs (advertising, taxes, etc.)
Using the free Amazon FBA calculator, you get a rough estimate of referral fees, processing fees, and other costs. This free tool doesn't include such vital costs, such as ACoS (Cost of Advertising Sales), marketing expenses, taxes (which vary by state and country), and overhead costs such as employee salaries or Cost of Goods.
SelleRise Amazon FBA software calculates all costs for each of your products.
Within the Celler Central, you have a lot of different options to present your data, however, not all of the metrics you need to accurately estimate your product performance are available there. Unlike Seller Central, SaaS (software as a service) tools for Amazon FBA sellers have more specific options, helping you understand your KPIs.
Here are some of the restrictions that FBA sellers have in the Seller Central:
- You can only filter sales by pre-defined dates in Seller Central: today, last week, last 30 days, and more. You can't select a custom date range.
- You can't save advertising data (PPC) for more than 60 days in Seller Central.
- You can't see organic and advertising sales separately.
- You can't see profits for each product.
Our Amazon FBA tool SelleRise doesn't have these awkward limitations. By connecting your account to our service, you will get numbers of your profit understandably. You will forget about the fuss of Excel reports and confusing formulas.
Take a look at the screenshots of the tool below. Your data from Seller Central is presented in the Profit Dashboard and Product Dashboard.
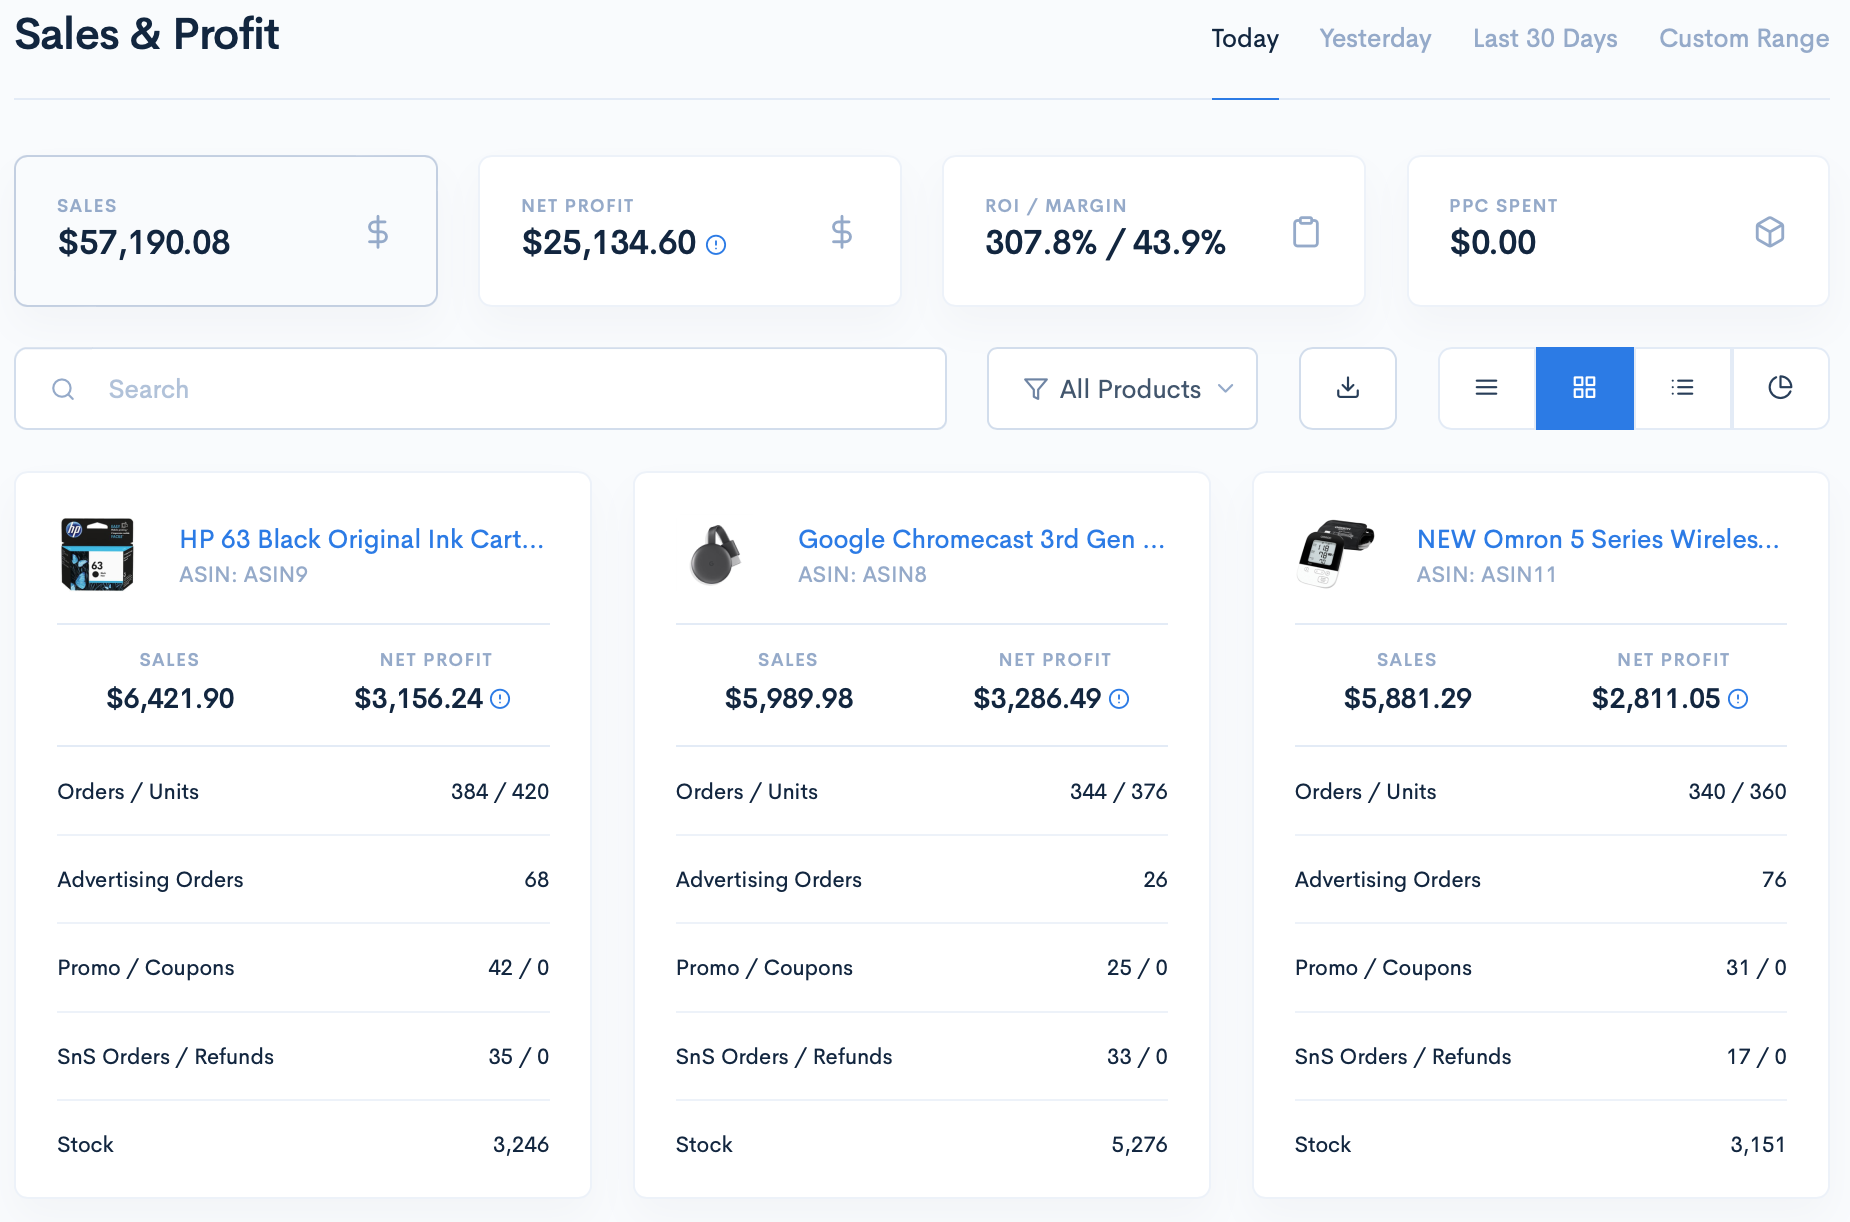
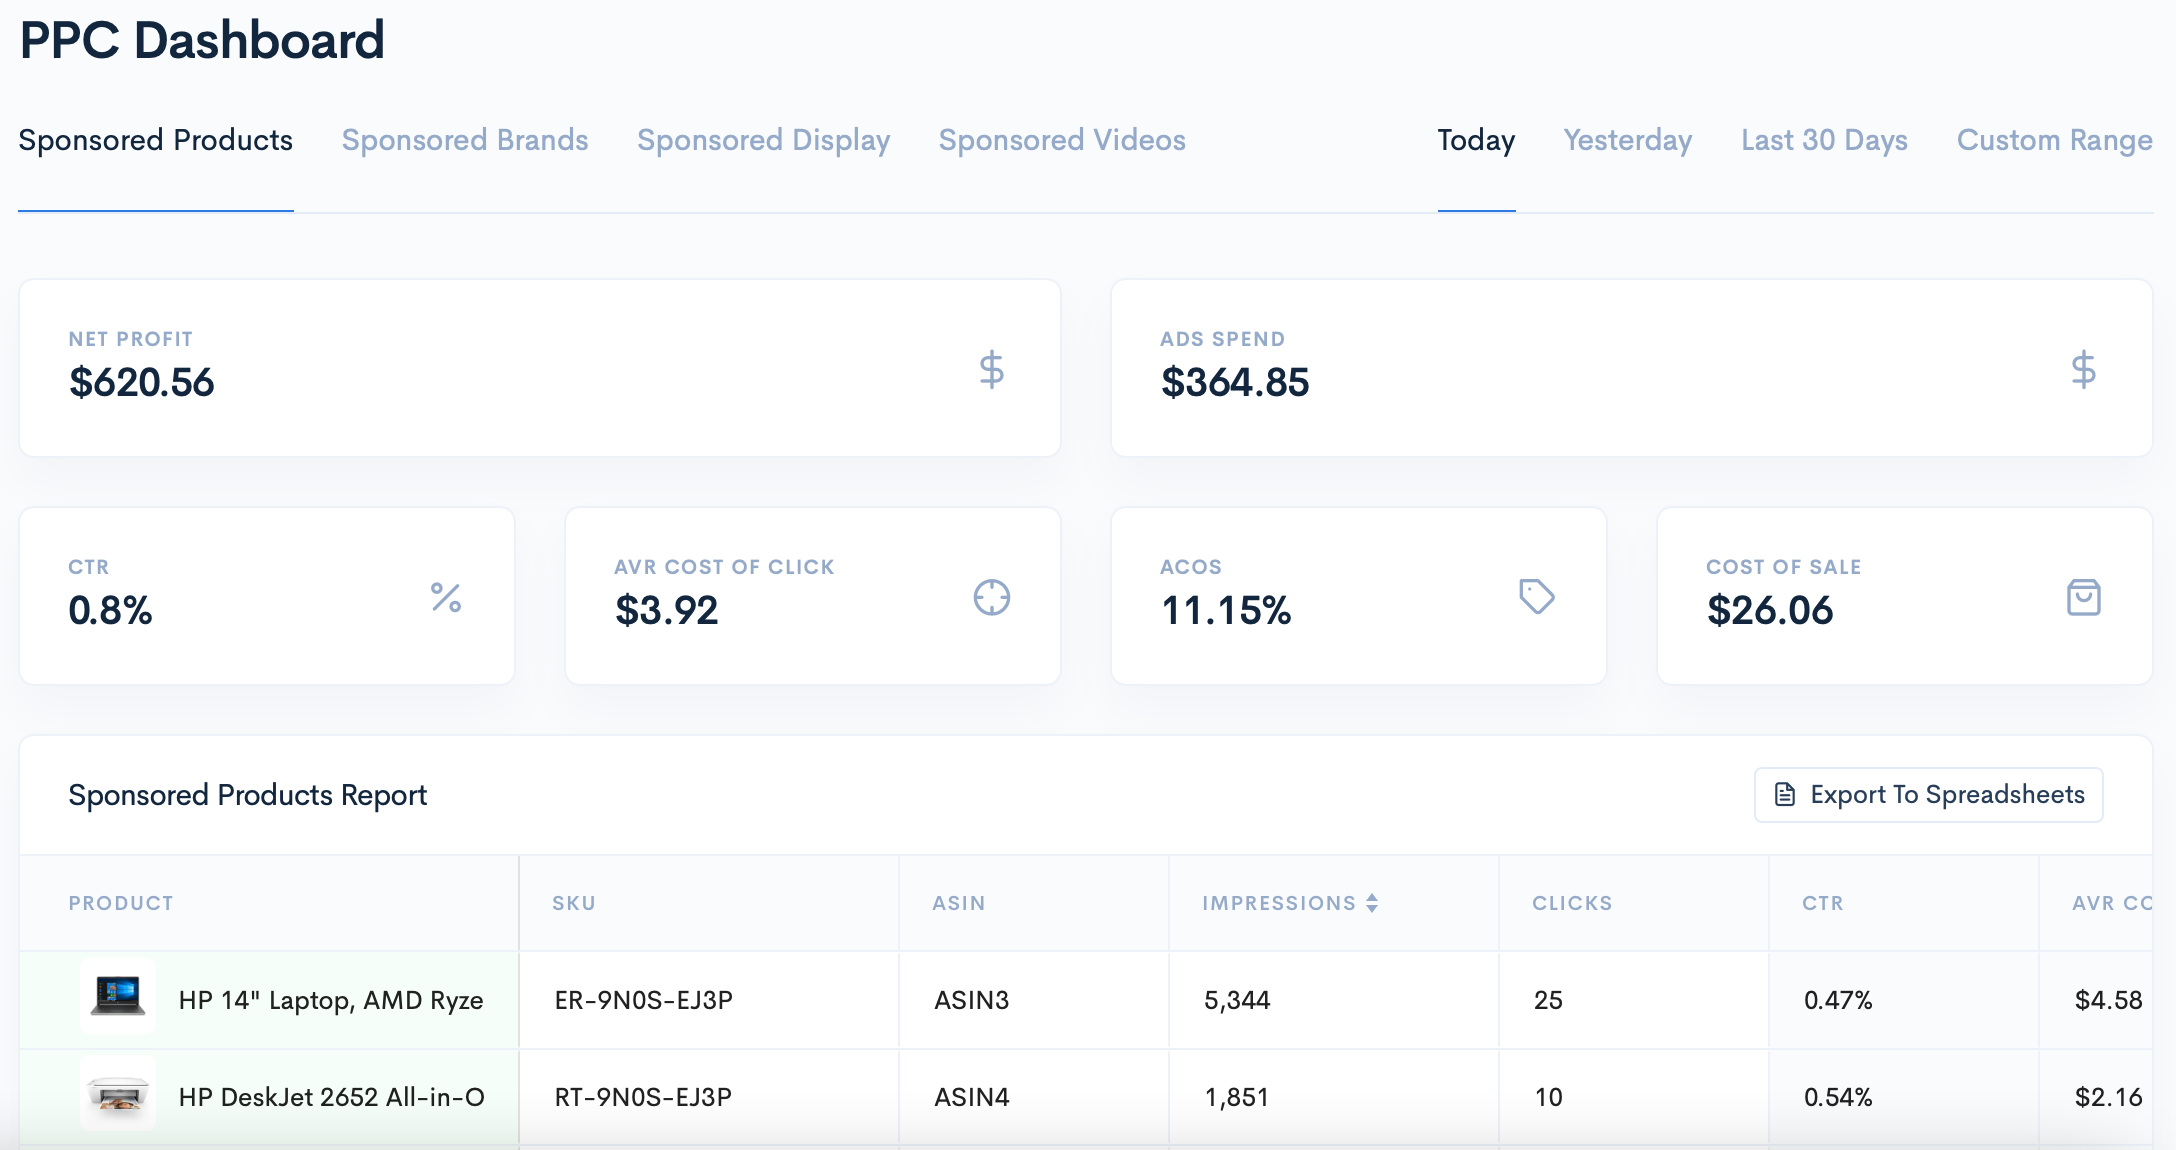
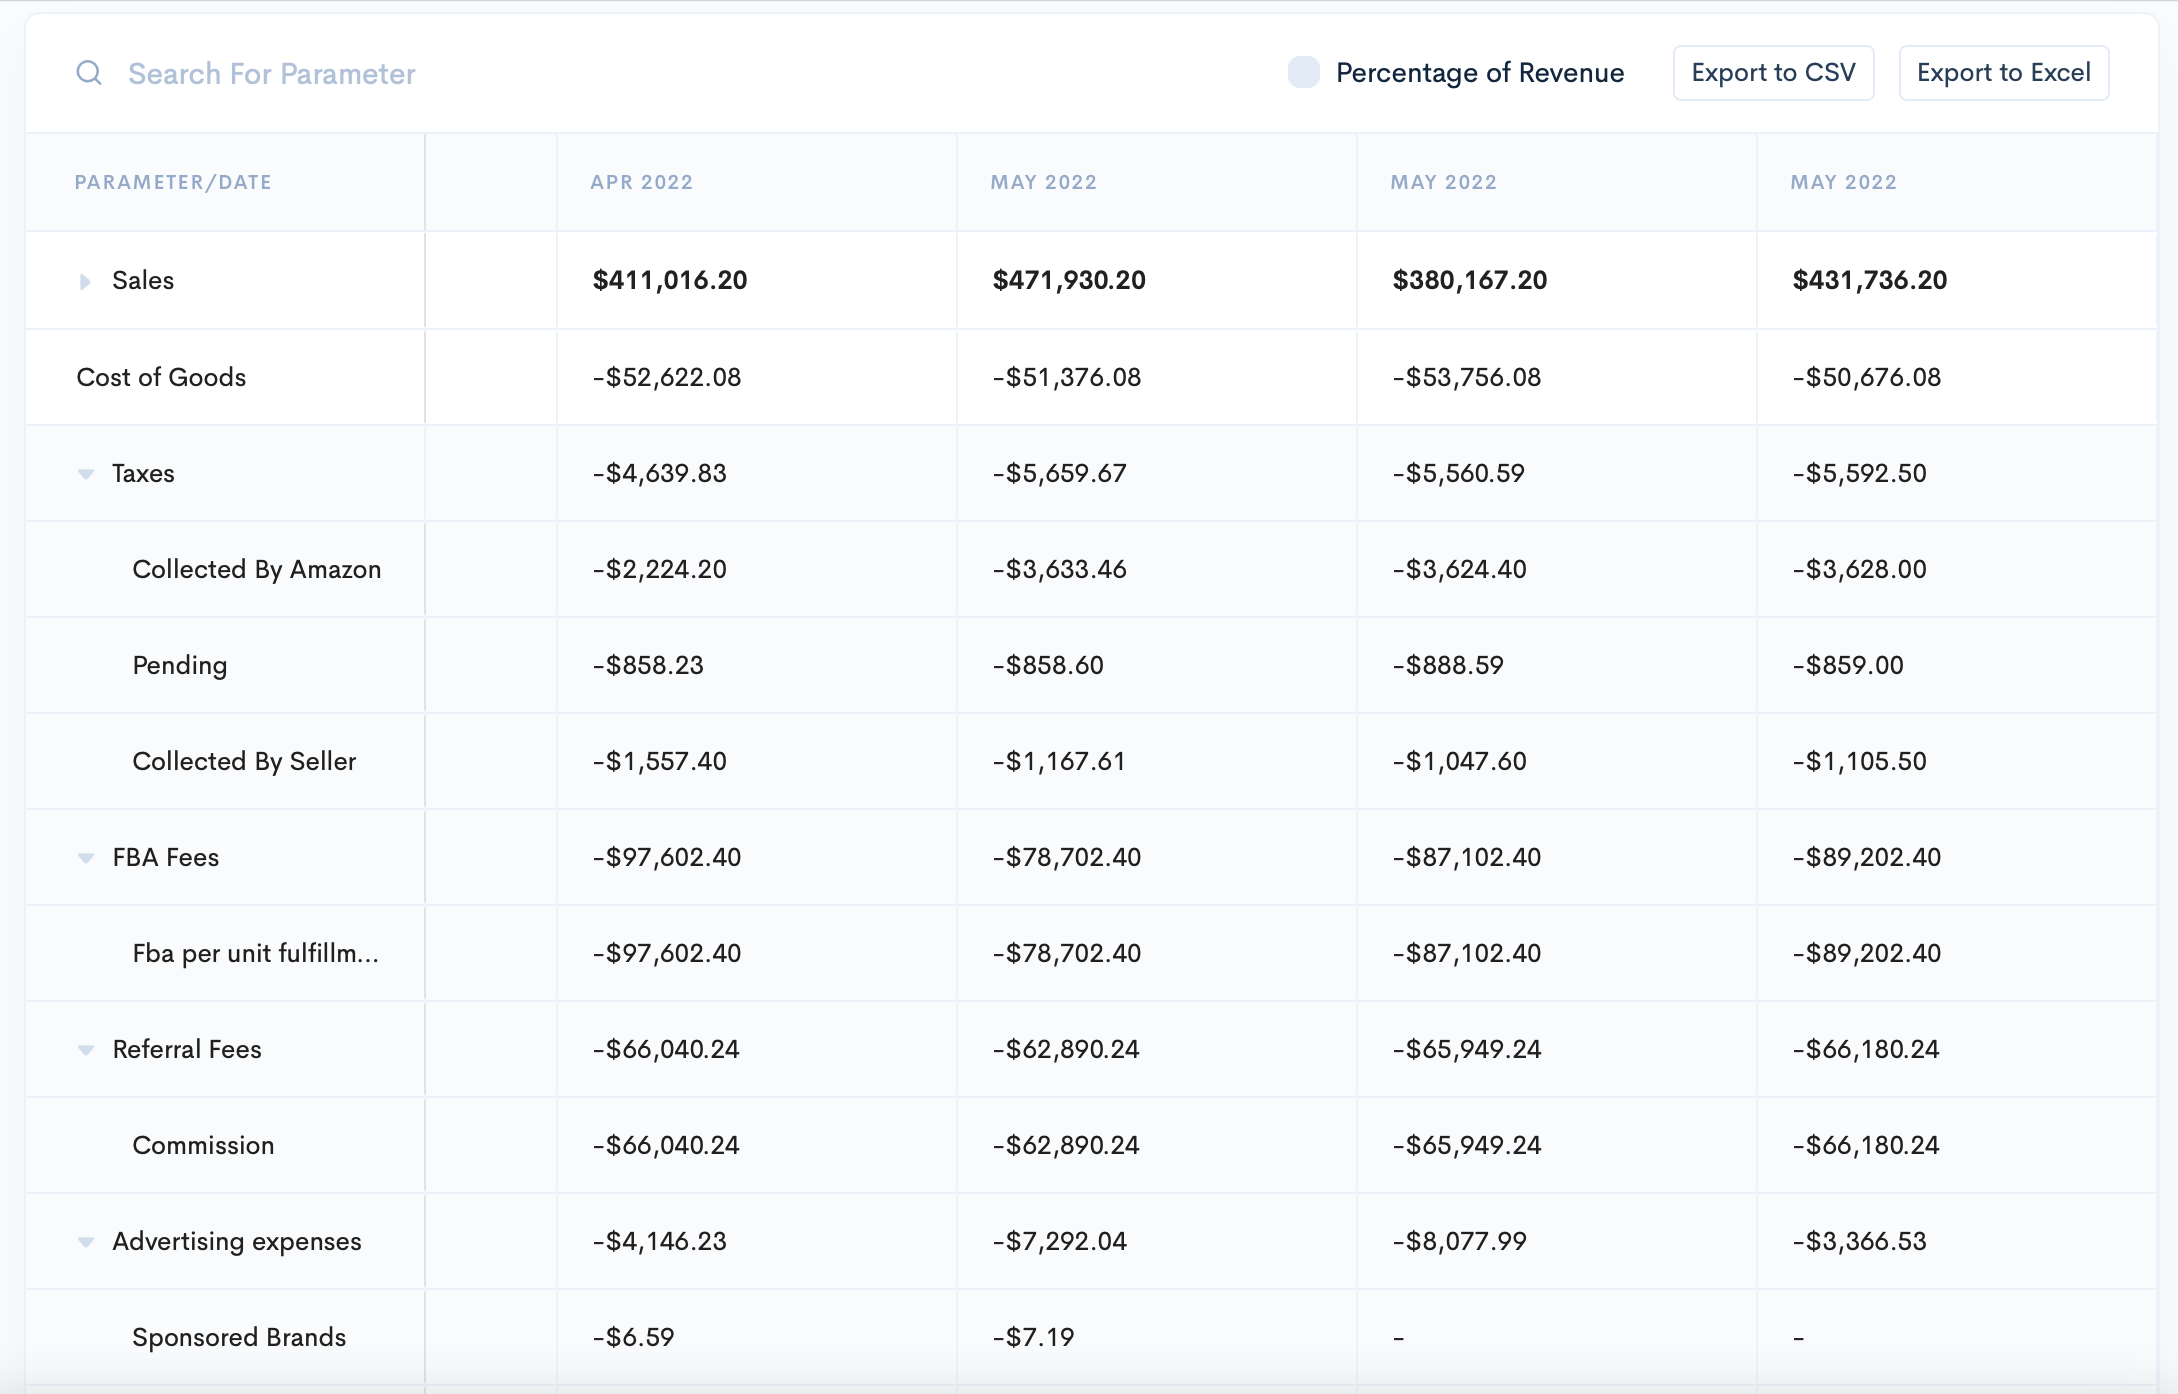
SelleRise Dashboards
It will automatically show you:
- Profit
- FBA Fees
- Amazon Fees
- PPC Costs
- Shipping Costs
- Cost of Goods Sold*
*These costs are entered in the SelleRise Inventory page.
Enjoy your sales, and don’t forget about your product’s profitability and KPIs. It’s very important to keep track of them as they show your account health. To do the analysis easily, you can use Business Analytics Seller tools, like SelleRise. With this tool, you can keep track of your sales, costs, and profits and see where you can optimize them. Also, you can see sales and profit dynamics showing you how healthy is your business.
Managing your profit and keeping track of accounting has never been easier for Amazon FBA Sellers – try SelleRise and get 14-days free trial benefits!
It's a pretty good time to make sure it's the simplest service.