Aloha, Amazon Seller!
Amazon Seller Central reports can help grow your business. Learn about the different types of reports and how you can use them to optimize your business.
For every seller on Amazon.com, it is very important to analyze your sales history and account health. This is not only because you don’t want to lose money and need to control your sales and profit dynamics, product conversion rate data, and customer base growth. This is also because your account health influences your ranking on Amazon.
Constant monitoring of your major product metrics is a prerequisite to your success as a seller. Business analytics information helps you detect the best and worst-performing products, see the relevance of the marketing and advertising strategies you apply and understand how to adjust them to achieve the desired result. Also, you can monitor customer behavior to drive conversions.
Apart from that, you need to monitor a variety of metrics, ranging from inventory management data to payments and taxes. Amazon offers a lot of tools to help proactive Amazon sellers record and analyze their store’s, brand’s, and products’ stats. Among those in your Seller Central, you have Amazon seller reports. Some of the metrics, that are not available in Amazon reports, you can monitor using third-party Amazon seller tools.
In this post, we will discuss what are the type of report a seller on Amazon can find, and how to use Amazon Seller Central reports.
What Are Amazon Seller Central Reports?
Amazon Seller Central Reports provide data to help you track how your business is performing. These reports allow you to monitor how your business develops to make informed decisions about your sales tactics and strategies.
Reports help you sort out, select, and analyze valuable data to improve your business performance. In these reports, you can find detailed information and graphs showing your sales indicators, order fulfillment, payment history, etc.
What Are the Types of Amazon Seller Central Reports?
Amazon Seller Central Reports are:
- Business Reports;
- Fulfillment Reports;
- Advertising Reports;
- Return Reports
- Payments Reports;
- Custom Reports;
- Amazon Selling Coach;
- Tax Document Library.
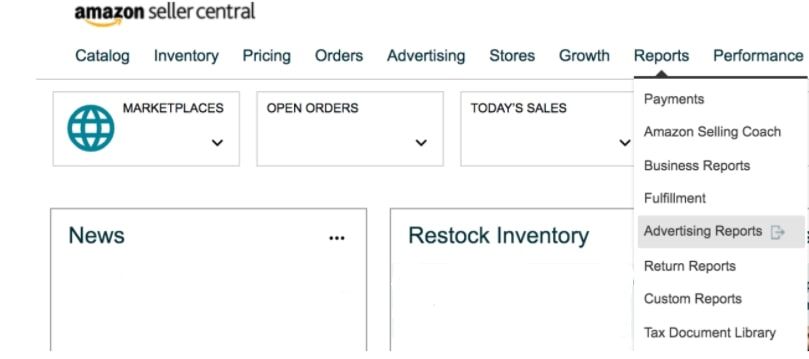
In your Amazon Seller Central, you can find all these reports when you click on the “Reports” tab.

There are also other types of reports, available to the brand owners enrolled in the Brand Registry.
Business Reports
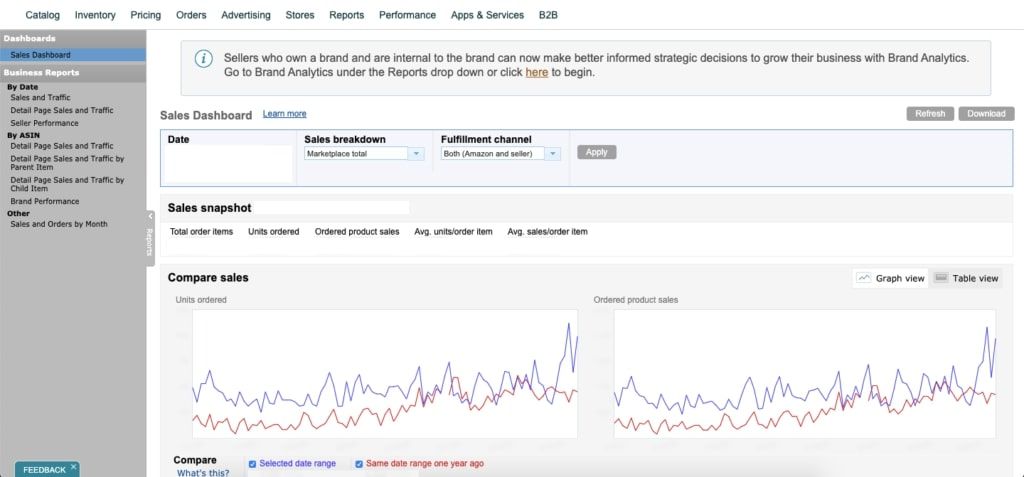
Business reports give a seller valuable insights into their sales, traffic, and performance.
Amazon business reports are structured by date and ASIN. The reports by date are Sales and Traffic, Detail Page Sales and Traffic, and Seller Performance. The reports by ASIN are Detail Page Sales and Traffic, Detail Page Sales and Traffic by Parent Item, Detail Page Sales and Traffic by Child Item, and Brand Performance. You also have the Sales and Order by Month report.
In these reports, you can find a lot of data viewed from different angles. The most important of them are as follows.
Units Ordered is the number of units customers ordered. Here you can see the products generating volumes.
Total Sales shows the ordered product sales (item price multiplied by the ordered units) and gross product sales (item sales, add-ons, and shipping cost). If you sell a lot, your rank on Amazon is high.
Page Views is the number of visits to your store within a specific time span. Every page is counted separately, so if a shopper views three pages within your store, it counts as three page views. If this metric is low, you need to review your listing elements and researched keywords.
Sessions show how many times a shopper visited your store within a specific time span. If a customer purchasing multiple items in your store during one visit, this is considered one session. If he has taken a decision to come back to your store and buy more products, this will be a second session.
If your sessions are low, make sure your listings are in the correct category, review your listing elements, and researched keywords.
It is a good sign if the number of page views is higher than the number of sessions. This shows that the shoppers are interested and browsing multiple products.
Also please note that high traffic alone is not always good, it should drive conversions. If you target irrelevant keywords, your sessions may increase but your conversions may go down.
Conversion Rate shows the percentage of shoppers who added your product to their carts. A target conversion rate on Amazon is 5-10%. If you have a 10% conversion rate, this, most likely, shows that your listing is well-optimized, your price is fair, and your product has good reviews.
If your conversion rate is below 5%, review your listing elements (images, title, bullets, description, price, keywords, A+ content), and reviews.
Buy Box Percentage is a metric that tells you how often your product shows up in the Amazon Buy Box. If shoppers view your product 100 times and it shows up in the Buy Box 90 of those times, then your Buy Box percentage is 80%.
Your Buy Box percentage should, theoretically, be at 100% if you are a private label seller and the only seller on the listing. If your buy box percentage is low, this most likely shows that there are too many sellers on the listing or your product is priced too high.
You can view these reports by navigating to Reports > Business Reports.

Advertising Reports
For the seller, the most useful advertising reports for optimizing your PPC campaigns are Search Term reports, Targeting reports, and Advertised Product reports.
Search Term Reports reveal the keywords shoppers use to search and buy your and your competitors’ products, and the keywords driving the most conversions. It is extremely important to target the relevant keywords, and this report is a source of useful keyword tips. You can also find keywords with high-yield ACoS and RoAS, and optimize your running PPC campaigns.
Targeting Reports and Keyword Reports (for Sponsored Product campaigns) and keyword reports (for Sponsored Brand campaigns), detail sales and performance metrics for targets in all campaigns that received at least one impression.
The targeting report shows your targeted keywords, categories, or specific ASINs. Differently from Search Term reports, they don’t indicate customers’ keywords.
Targeting reports help you monitor how your targets are performing, and optimize your bids, identify any duplicate keywords, and detect other potential issues with your listings.
Consider targets that do not have an ACoS. This means that customers are clicking on your ads, but they’re not purchasing your product. Also, keywords that gain a lot of impressions and clicks but no conversions may show that you need to optimize listing to increase conversions.
Advertised Product Report provides detailed sales and performance metrics for advertised ASINs and show which of them are getting more or less impressions.
Purchased product report shows the cases when your ad for one product has brought shoppers to purchase another product in your line. Such cases are displayed in the purchased product report, where you can find out which of your non-advertised products customers buy after clicking on your ad. You can then add these products to your campaigns.
Search term impression share report (SIS) tells you the numeric rank of your impression share relative to other advertisers for each individual keyword that you are targeting. To put it simply, it compares your ads to your competitor’s ads.
The Placement report shows how your ads perform based on their location. Depending on your bid, your ads could appear at the top of Amazon search results, in the middle or closer to the bottom, or on a competitor’s product detail page.
Campaign placement report is similar to the placement report, it shows you how your campaigns perform based on their location.
Keyword placement report allows you to review sales and performance metrics for keywords depending on placement type.
Campaign report details your total campaign’s performance.
Performance over time report shows how your campaigns behave over time.
You can view these reports by navigating to Reports > Advertising Reports.
Return Reports
Return reports indicate how many returns you received within a certain time period, how often your product is returned, and the reasons why customers return items.
This tool allows you to generate reports related to customer returns. This way, you can analyze returned date, order ID, merchant SKU, ASIN, FNSKU, title, quantity, FC, disposition, customer return reason.
You can view these reports by navigating to Reports > Return Reports.
Fulfillment Reports
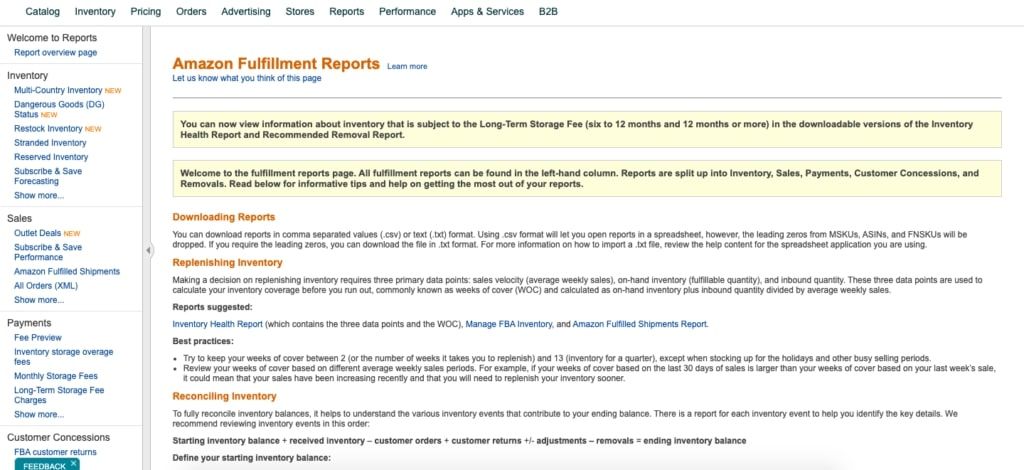
These reports reveal orders fulfillment efficiency. It is important to look at inventory levels, inventory age, returns, and payments. Amazon Fulfillment Reports is a very extensive section with many detailed reports related to each parent category. They cover six main areas: inventory, sales, payments, customer concessions, removals, Amazon Global logistics.
Here you can also download the Long-Term Storage Fee report for the products with a period of 6 to 12 months or more.
You can view these reports by navigating to Reports > Fulfillment.

Payment Reports
Payment reports help monitor account activity by providing a detailed breakdown of transactions including Amazon charges and refunds.
The payments dashboard has the following views:
Statement View - general information about your net proceeds (net amount from beginning balance and sales fewer refunds, expenses, loan repayments, and amount in account reserve);
Transaction View shows all your transactions, and you can filter them by type;
All Statements shows details related to your account statements by settlement period;
Disbursements show your disbursements by date/period;
Date Range Report allows you to track a transaction and generate a report based on the date you marked the orders as shipped.
You can view these reports by navigating to Reports > Payment.
Amazon Selling Coach
Amazon Selling Coach gives a seller personalized recommendations on how you can reach success in your sales with regard to inventory, products, fulfillment, pricing, and advertising.
The Selling Coach dashboard includes:
Selling Coach Reports are recommendations on how to improve your inventory management, products, fulfillment, and advertising;
Preferences is a list of popular products that may have limited availability on Amazon and show you the market gaps;
Communication is your Selling Coach emails, communications, and tips for a successful business;
Search Recommendations enables you to look for recommendations by product title, brand, category, or ASIN;
Refined Opportunities is a list containing all items you chose from Selling Coach;
Email Settings is the place where you can edit language preferences, email address, and notifications.
You can view Amazon Selling Coach by navigating to Reports > Amazon Selling Coach.
Custom Reports
This tool allows you to generate your own custom reports in .csv format to view in Excel, including suggestions from Amazon to improve your metrics.
They include Active Reports and Archived Reports.
You can view these reports by navigating to Reports > Custom Reports.
Tax Document Library
Tax Document Library is an Amazon Seller Central sales tax report.
In this library, you can find Seller Fee Tax Invoices, Tax-Exemption Certificates, and Tax Invoices.
In the Sales Tax Report section, you can create a Sales Tax Calculation Report; Marketplace Tax Collection Report; and Combined Sales Tax Report.
When you activate Amazon tax calculation services, you can access a glossary of terms in your Sales Tax Report. It opens when you click on “Learn more,” next to the Tax Document Library title.
You can view Tax Document Library by navigating to Reports > Tax Document Library.
How to Use Amazon Seller Central Reports to Track Business Performance?
Of the above, two reports majorly focus on business performance: Business and Advertising reports. These Amazon sales reports allow you to monitor the efficiency of your business metrics: units ordered, total sales, page views, sessions, conversion rate, and Buy Box percentage, and ad efficiency metrics: search terms, targeting, advertised product, placement, purchased product, performance over time.
Monitoring of these metrics allows you to:
- Find your best products for Amazon PPC;
- Find products that aren’t converting;
- See how your business is doing overall;
- Research keywords using Amazon Search Terms;
- Optimize your ad campaigns;
- Improve your inventory management.
Are There Business Metrics Not Covered by Amazon Seller Central Reports?
There are a number of metrics missing in these reports. For instance, you can't see your organic sales and PPC sales figures separately, which is important to calculate TACoS (ACoS) and RoAS to measure the efficiency of your ad campaigns.
You also can’t track all your Amazon fees in detail and monitor how and when Amazon changes them. Keeping track of your figures is a key to maximizing your profits.
You can get your Amazon sales report, monitor the efficiency of all your product business metrics, and all your product KPIs with SelleRise’s dashboards. Get your easy and visual business analytics with SelleRise's dashboards. Try them now, it’s free.


